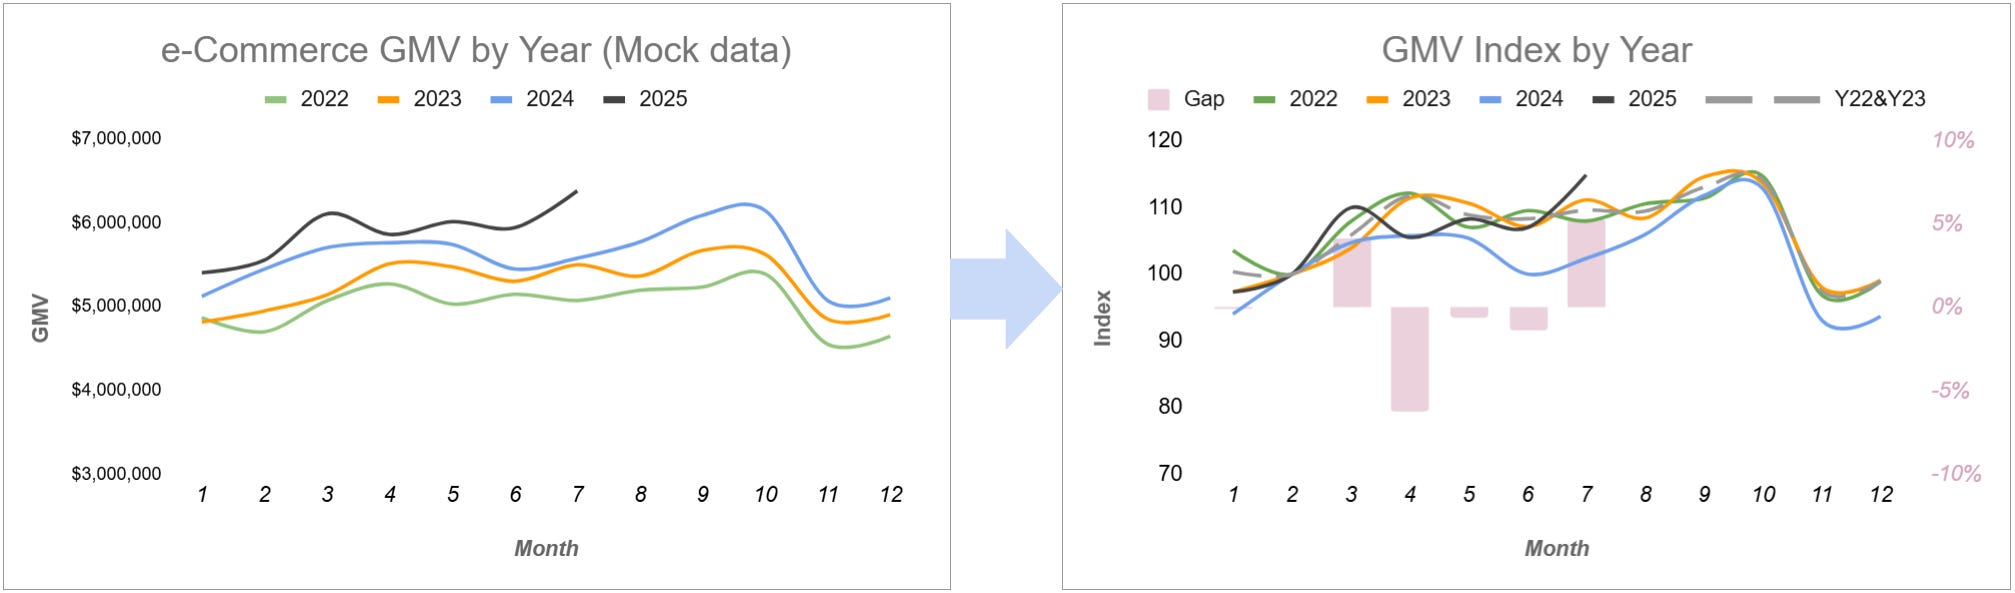
SQL Calculation Combines YoY and Pre/Post Comparison
Analyzing Metrics Through a Dual Lens

Here is a SQL framework that combines Year-over-Year and Pre/Post comparison in metric performance analysis.
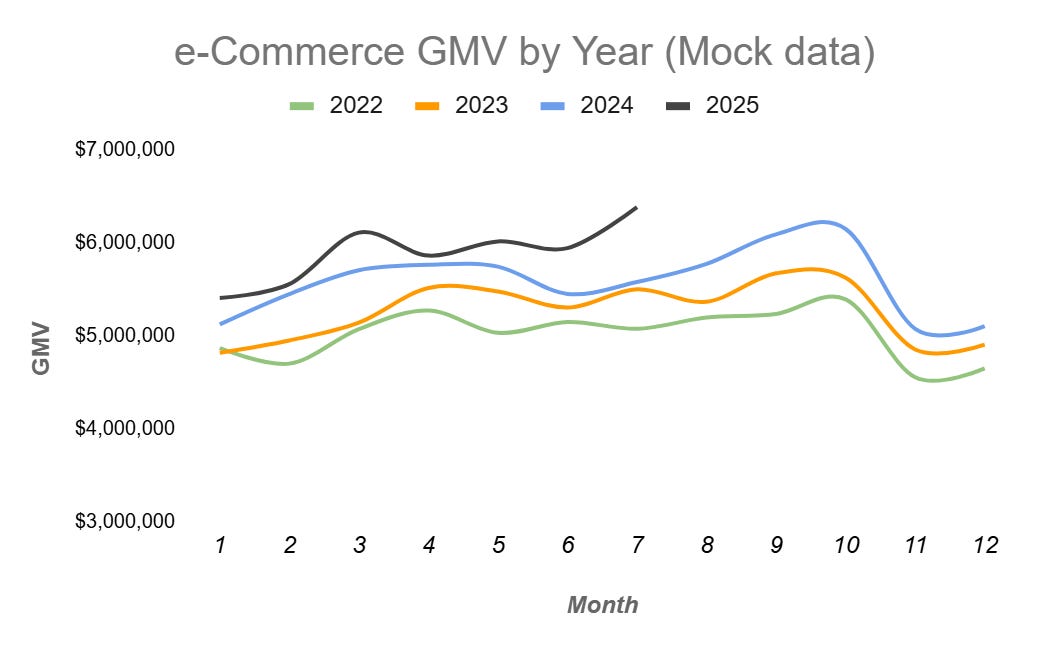
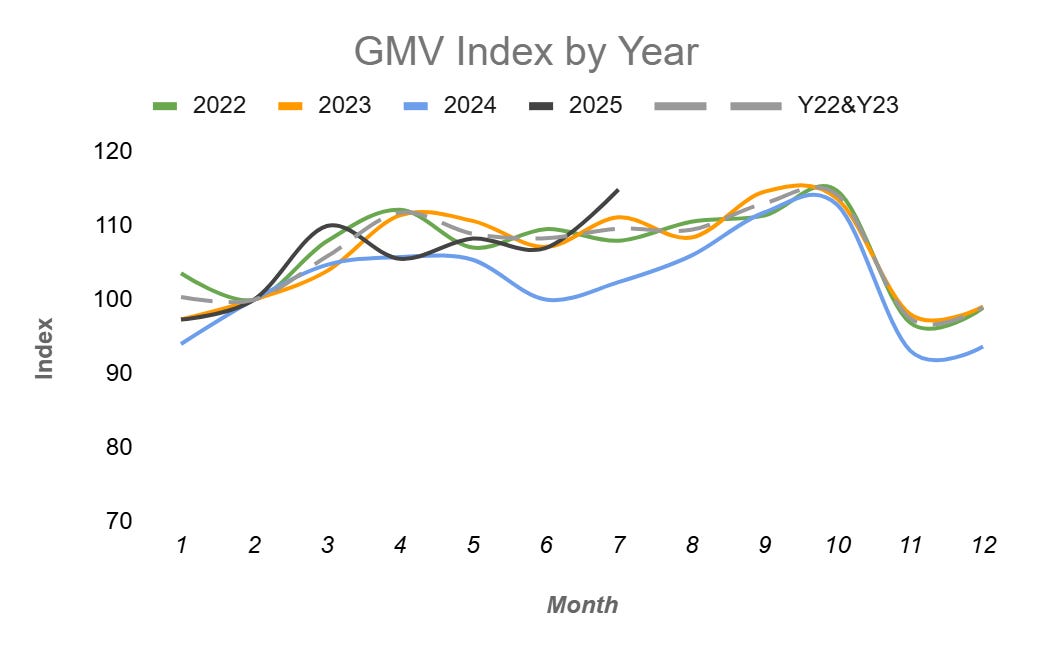
When tracking metrics like GMV in e-commerce or retail, it’s common to consider seasonal swings out for real growth. To do so, analysts usually benchmark performance in both two ways:
(a) comparing against a selected pre-period;
(b) comparing against the same period in the prior years.
This dual lens helps separate genuine performance shifts from natural effects—and enables more confident in root cause analysis.
YoY & Pre/Post Framework
How to combine both? Here’s the idea:
Select the analysis windows: (Pre / Post)
Post window: the current period we want to analyze;
Pre window: A know stable period (right) before the post window.
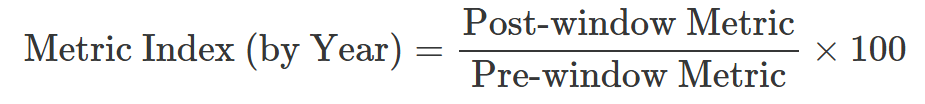
Build a metric index: (Compare post vs. pre)

Think of this as a way to normalize metric against a stable reference point we chosen.
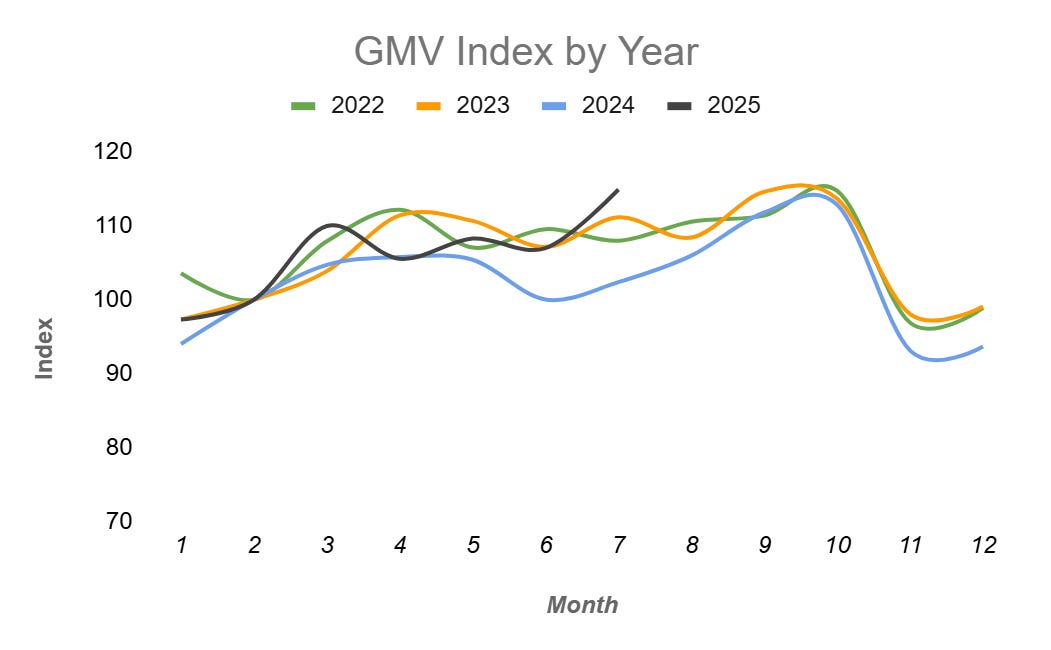
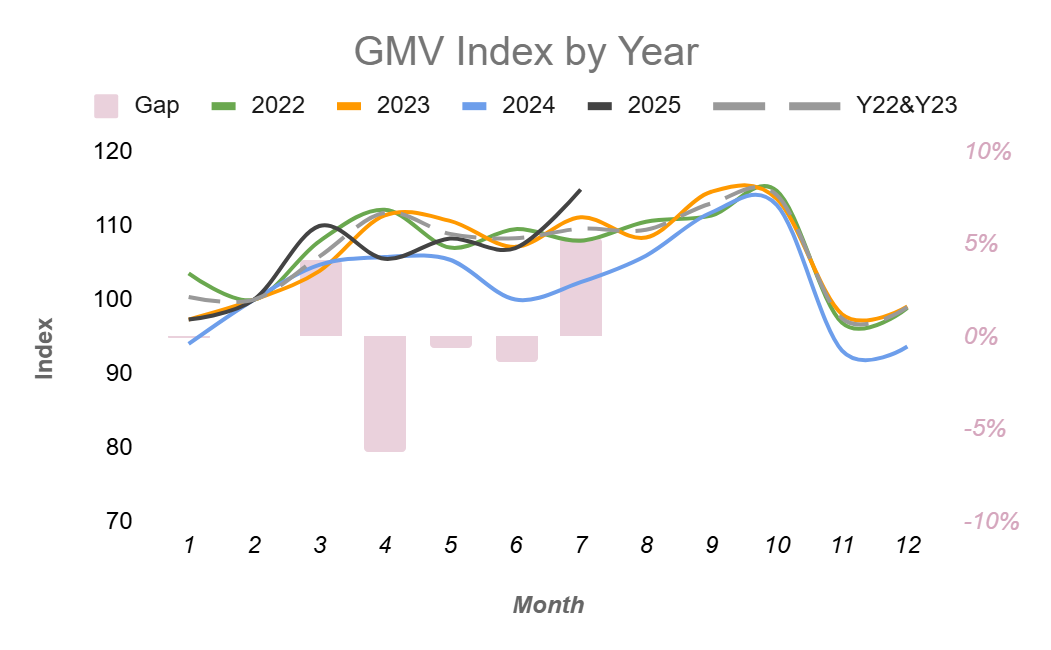
Measure the index gap: (Layer on the YoY comparison)

The index gap, as an indirect indicator, shows how current growth compares to historical trends—whether it’s stronger or weaker than expected.

🧪SQL Break Down
Now let’s implement this in SQL.
Sample Dataset
Here’s a simple sample dataset with weekly e-commerce GMV by category:
Step 1, Prepare the data:
Column
year_id,week_idcan help us in over-year comparison;
-- Step 1: Add year/week id; Filter by date range
CREATE TEMPORARY TABLE raw_data_weekly AS
SELECT
    Date             AS week_date,
    Year(Date)       AS year_id,
    WeekofYear(Date) AS week_id,
    Category,
    GMV
FROM raw_data_table
where date >= '2020-01-01'
group by 1, 2, 3, 4
;
Add a Pre / Post window tag, and when the window selection changes, we can simply edit the
WHEREclause in the temporary tablewindow_tag.
-- Step 1: Define PRE and POST windows
CREATE TEMPORARY TABLE window_tag AS
SELECT
    'PRE' AS window_type,
    week_id
FROM raw_data_weekly
WHERE week_date IN ('2025-05-01', '2025-05-08')

UNION ALL

SELECT
    'POST' AS window_type,
    week_id
FROM raw_data_weekly
WHERE week_date IN ('2025-07-01')
;

-- Step 1: Combine weekly raw data and window tag to create the working dataset
CREATE TEMPORARY TABLE data_table AS
SELECT
    b.window_type,
    a.week_date,
    a.year_id,
    a.week_id,
    a.Category,
    a.GMV
FROM raw_data_weekly AS a
LEFT JOIN window_tag AS b
    ON a.week_id = b.week_id
;
Step 2, Then calculated the GMV index
by dividing GMV by its baseline average and scaling the result to 100, at the level of each year × dimensions.
(Note that the index is defined at the year and dimension level. Here, the only dimension we use is category.)
-- Step 2: Calculate index benchmark by average in Pre window
CREATE TEMP TABLE index_bench_table AS
SELECT
    year_id,
    category,
    AVG(GMV) AS index_bench
FROM data_table
WHERE window_type = 'PRE'
GROUP BY 1, 2
;

-- Step 2: Calculate GMV index
CREATE TEMP TABLE index_data AS
SELECT
    a.week_date,
    a.year_id,
    a.week_id,
    a.category,
    a.GMV,
    b.index_bench AS index_bench,
    (a.GMV / b.index_bench) * 100 AS GMV_Index
FROM data_table a
LEFT JOIN index_bench_table b
  ON a.year = b.year AND a.category = b.category
;
Step 3, Calculated gap of GMV index
between current year (CY) and historical year (HY).
-- Step 3: current year (CY) index
CREATE TEMP TABLE index_data_CY AS
SELECT
    week_date,
    week_id,
    category,
    index_bench,
    GMV_Index AS GMV_Index
FROM index_data
WHERE year_id = 2025
;

-- Step 3: Historical year (HY) average index
CREATE TEMP TABLE index_data_HY AS
SELECT
    week_id,
    category,
    AVG(index_bench) AS index_bench,
    AVG(GMV_Index)   AS GMV_Index
FROM index_data
WHERE year_id IN (2022, 2023, 2024)
GROUP BY 1, 2
;

-- Step 3: Consolidate index for current and historical year
CREATE TEMP TABLE index_comparison_table AS
SELECT
    a.week_date,
    a.week_id,
    a.category,
    a.GMV         AS GMV_CY,
    b.GMV         AS GMV_HY,
    a.index_bench AS Index_bench_CY,
    b.index_bench AS Index_bench_HY,
    a.GMV_Index   AS GMV_Index_CY,
    b.GMV_Index   AS GMV_Index_HY
FROM index_data_CY a
LEFT JOIN index_data_HY b
    ON a.week_id = b.week_id AND a.category = b.category
;
Instead of calculating a.GMV_Index_CY - b.GMV_Index_HY AS GMV_Index_Gap directly, I suggest we create an index_comparison_table, then analyze the GMV Index Gap at any aggregated or detailed data level we want:
-- Analysis: Calculate GMV index gap (CY - HY), at

-- Overall Level
SELECT
    week_id,
    SUM(GMV_CY) / SUM(Index_bench_CY) * 100     AS GMV_Index_CY,
    SUM(GMV_HY) / SUM(Index_bench_HY) * 100     AS GMV_Index_HY,
    SUM(GMV_CY) / SUM(Index_bench_CY) * 100
      - SUM(GMV_HY) / SUM(Index_bench_HY) * 100 AS GMV_Index_Gap
FROM index_comparison_table
GROUP BY 1
ORDER BY 1
;

-- Category Level, Or more dimensions...
SELECT
    week_id,
    Category,
    SUM(GMV_CY) / SUM(Index_bench_CY) * 100     AS GMV_Index_CY,
    SUM(GMV_HY) / SUM(Index_bench_HY) * 100     AS GMV_Index_HY,
    SUM(GMV_CY) / SUM(Index_bench_CY) * 100
      - SUM(GMV_HY) / SUM(Index_bench_HY) * 100 AS GMV_Index_Gap
FROM index_comparison_table
GROUP BY 1, 2
ORDER BY 1
;
🔍 Analyze the Index Gap
Now that we’ve calculated the index gap in SQL, we can easily analyze and diagnose metric performance using a both Pre/Post and YoY method.
For example, consider category A on 2025-07-01:
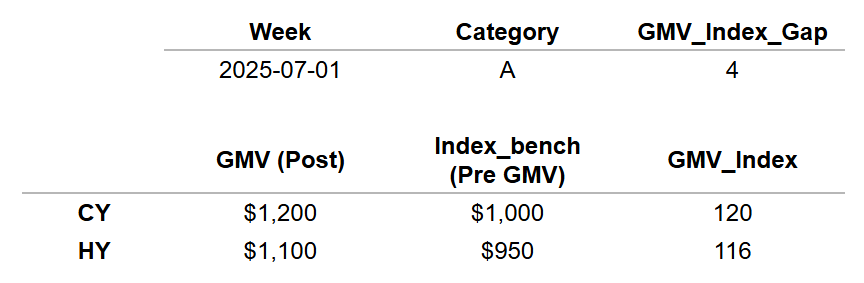
The GMV_Index shows performance relative to the pre-period benchmark:
CY (120) is +20% above its pre-period baseline, while HY (116) was +16% above historically—normalizing to 100 makes comparisons clear.
The GMV_Index_Gap is the difference between CY and HY indices:
120 − 116 = 4 means that this year’s post-period performance is +4% stronger than the historical baseline.
Taking It Further
What we can do next:
Anomaly Detection: Apply statistical or machine learning methods on the index gap to automatically flag unusual shifts.
AI-Powered Insights: For metrics with many dimensions, AI can help us summarize trends, detect patterns, and highlight the main drivers behind it.
💡 Now Try it
Take this framework for a spin on your own metrics.
Decide how you want to measure change—whether as a ratio or an absolute difference—and whether to calculate YoY or Pre/Post first.
Then break down the metric by dimensions that matter for your business, and try writing your own version of the SQL framework.